
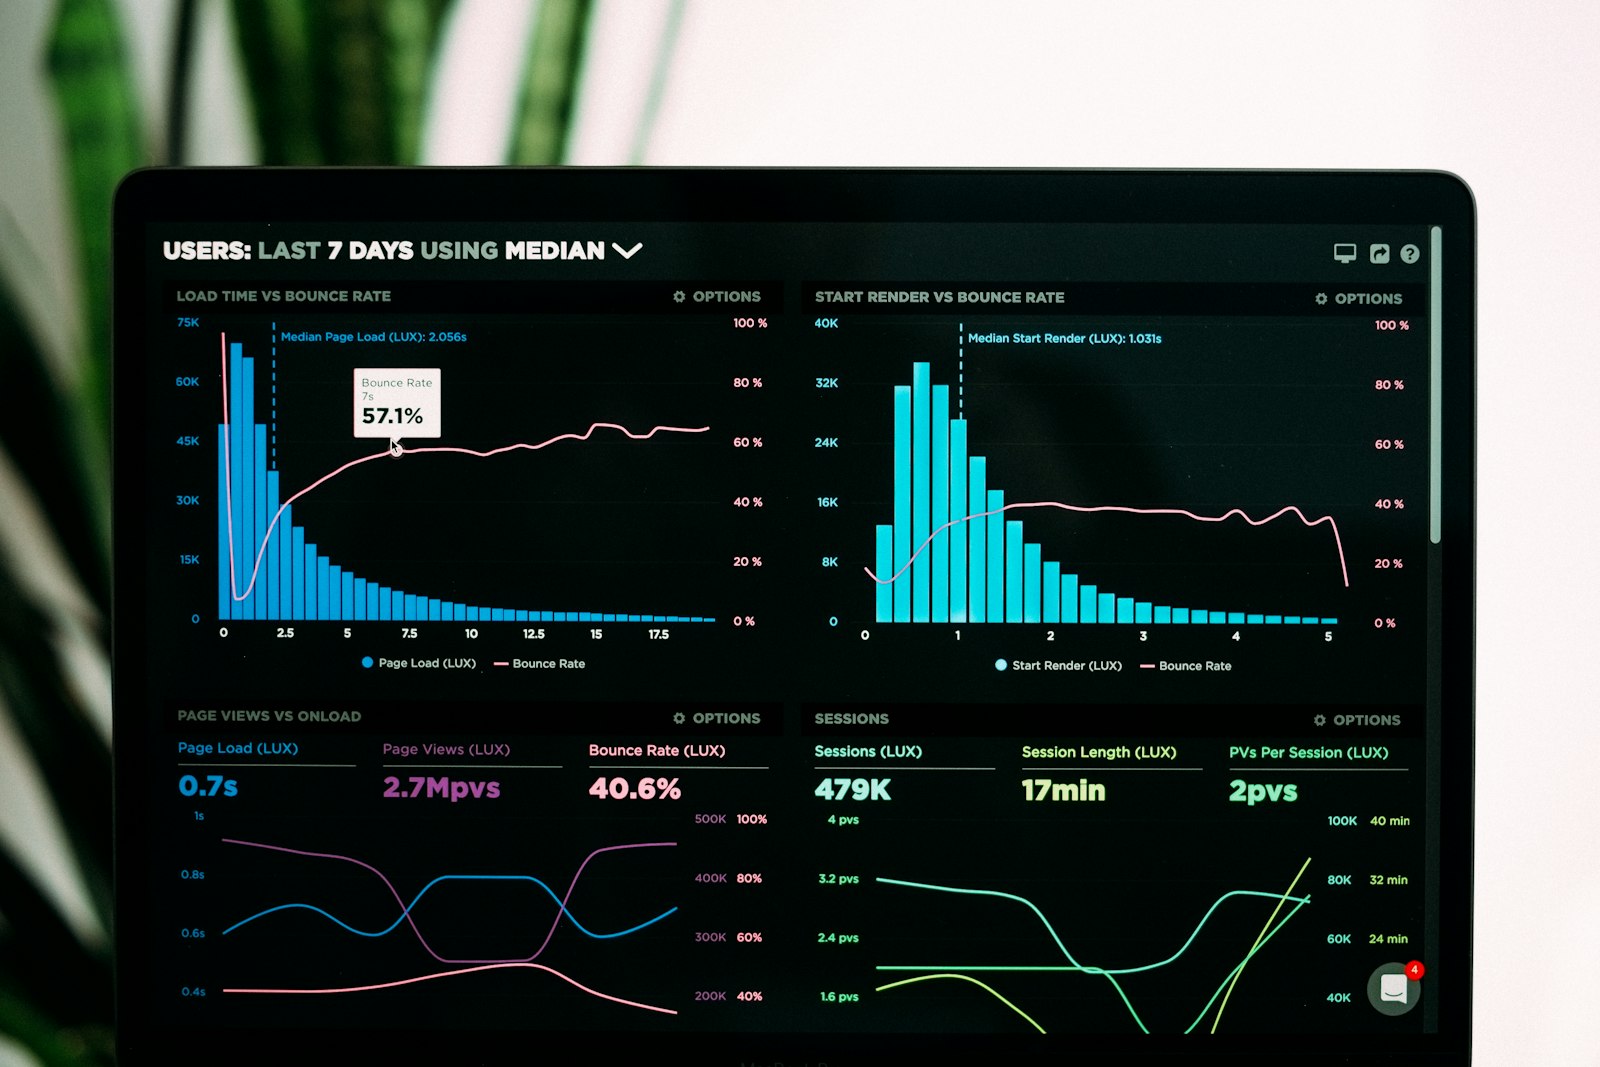
Business observability means watching the outcomes your product exists for, such as signups, orders, payments and the flows that fail for customers, as closely as engineers watch servers. A drop in payments then shows up the day it happens, not in next month's numbers.
Business observability, defined
In software, observability is the ability to tell what a system is doing from what it outputs: logs, metrics and traces. Business observability applies the same idea to the business. The outputs are business events: a user signed up, an order was paid, a payment failed, an import finished.
The goal is the same as with servers. You want to know that something is wrong before a customer tells you, and you want enough detail to see where.
Large observability vendors use the term too. Dynatrace and New Relic describe business observability as connecting application data to business outcomes, and Datadog offers real-time business intelligence. For a smaller product the principle is simpler: count the events that matter and look at them on a fixed schedule.
Business observability, IT observability and BI
The three overlap, but they answer different questions.
| IT observability | Business observability | Business intelligence (BI) | |
|---|---|---|---|
| Question | Is the system working? | Is the business working right now? | Why did the quarter turn out this way? |
| Signals | Logs, metrics, traces, errors | Business events: signups, orders, payments, failed customer flows | Historical data in a warehouse |
| Time frame | Seconds to minutes | Hours to a day | Weeks to quarters |
| Who looks | Engineers on call | Founders, product, operations | Analysts, leadership |
| Typical output | Alerts and dashboards | Scheduled summaries, alerts on business events | Dashboards and reports |
Monitoring and observability tools are very good at the first column. BI is good at the last. The middle column is the one that often has no owner, especially in small teams.
Why "the servers are fine" is not enough
A system can be healthy and the business still be broken. Some ways that happens:
- A payment provider starts declining cards for one region. The app returns no errors, because the decline is a normal response.
- A release moves the signup button below the fold on phones. Uptime is 100%, signups halve.
- A nightly import job stops being scheduled. Nothing fails, because nothing runs.
- The link in a marketing email points to a page that no longer exists. Traffic looks fine; conversions don't come.
None of these shows up in an error log. All of them show up in a count of business events, as long as someone looks at it.
Which business signals to watch
Start with five to ten events that describe whether the product is working for its users. A useful set for most online products:
- Acquisition:
user_signup,trial_started - Activation: the first key action, such as
project_createdorfirst_report_sent - Revenue:
checkout_started,order_paid,subscription_renewed,payment_failed,refund_issued - Retention:
subscription_canceled,plan_downgraded - Product: the one or two features the product is built around, such as
export_completed - Operations:
job_completed,import_failed,email_bounced
Name each one as an event, and add a few tags where a breakdown helps, such as the plan (plan-pro) or the signup source (source-google). Keep tags to a small set of values: a tag per customer email or per order number turns a report into a list.
Failures matter as much as successes. A rising payment_failed or a job_completed that drops to zero is often the first sign that something broke.
Pull and push: why dashboards are not enough
Most teams move along a chain where every step adds clarity, but often also delay:
Dashboards are pull-based: someone has to remember to open them, know which one matters and judge whether the number is normal, every day. In a small team that habit fades, nothing looks broken, and a decline is noticed weeks later.
A scheduled summary is push-based. The numbers arrive at a fixed time, with the change since the last period, and you only open a dashboard or the logs when the summary shows something odd. That makes business observability a habit that doesn't depend on anyone remembering.
How to set up business observability
For a small team, the setup fits in an afternoon:
- List the events that describe the product's health, as above.
- Send an event from your code each time one happens. One HTTP request per event is enough; there is no need to send full user profiles.
- Pick a cadence: daily for operations and revenue, weekly for growth and product use, monthly for slower patterns.
- Compare like with like. Today against the previous report is a start, but a Sunday is usually quieter than a Monday, and a public holiday quieter still. A report that knows the calendar saves false alarms.
- Deliver it where you read. Email works for some teams; a team chat works better for others, because the first lines show up in the notification.
- Investigate with the tools you have. When the summary says payments dropped, the logs, the payment provider's dashboard or product analytics tell you why.
Sending an event is a single request. With Eventkiwi it looks like this:
curl -X POST "https://app.eventkiwi.com/api/event?_id=YOUR_AGGREGATOR_ID" \
  -H "Authorization: Bearer YOUR_API_KEY" \
  -H "Content-Type: application/json" \
  -d '{"name": "order_paid", "plan-pro": true}'
Any field besides name becomes a tag (here plan-pro). The API docs have helpers for JavaScript, Python, PHP, Ruby, Go and Rust.
Tools for business observability
- Observability platforms such as Dynatrace, New Relic and Datadog connect application telemetry with business data. They suit companies that already run them for their infrastructure.
- Product analytics such as PostHog, Mixpanel and Amplitude track what users do in the product: funnels, retention, paths. You open their dashboards to explore.
- Event reporting is the lighter option. Eventkiwi is the reporting layer for your product's events: your code sends business events, and Eventkiwi sends a report on your schedule (hourly, daily, weekly or monthly, in your timezone) by email or Telegram. Each report has a short written summary at the top, every event's count with the change since the last report, a trend line and tag breakdowns. An event that stops arriving is listed at 0 instead of disappearing, and the summary takes weekends and public holidays into account.
Eventkiwi's free trial covers 100 events; paid plans start at $19 a month for 10,000 events. See pricing.
Questions
Is business observability the same as BI? No. BI explains the past from historical data and is usually built by analysts. Business observability tells you, today, whether the business is working, so you can act this week.
Do I need an observability platform for it? Not for a small product. A list of business events, a way to count them and a report on a schedule covers most of it. Large platforms help when business data has to be joined with detailed application traces.
How is it different from alerts? Alerts fire on a threshold, which works when you know the threshold in advance. A daily or weekly summary also catches slow declines and changes nobody set an alert for. Many teams use both.
How many events should I track? Start with five to ten. A report with forty events gets skimmed; a report with eight gets read.